
periodic table trends (zip-Datei)

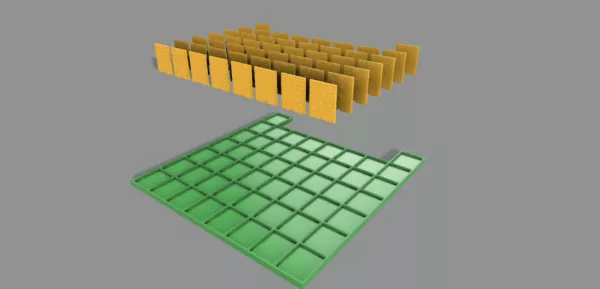
This is a print file for a tactile graphic of the periodic table. These tactile prints show different properties of elements in the periodic table. Height represents relative values, allowing trends to be explored. Individual elements are not labelled. Periodic Table – density: The height represents the relative density of each element. Most elements in Period 7 have unknown densities. Noble gases have very low height due to their gaseous state. Trends: Density generally increases down a group. Density increases toward the centre of a period and decreases at the edges. Data source: The Royal Society of Chemistry (UK). Lanthanides and Actinides are not included. Periodic Table – atomic radius: The height represents the relative (non-bonded) atomic radius. In Period 7, only the first three elements have known values; others are shown with no height. Trends: Atomic radius increases down a group. Atomic radius decreases across a period. Transition metals have similar atomic radii. Data source: The Royal Society of Chemistry (UK). Lanthanides and Actinides are not included. Periodic Table – electronegativity: The height represents electronegativity. Most elements in Period 7 and all noble gases have unknown values and are shown without height. Trends: Electronegativity increases across a period. Electronegativity decreases down a group. Data source: The Royal Society of Chemistry (UK). Lanthanides and Actinides are not included. Periodic Table – first ionisation energy: The height represents first ionisation energy. Many elements in Period 7 and astatine have unknown values and are shown without height. Trends: First ionisation energy decreases down a group. First ionisation energy increases across a period. Data source: The Royal Society of Chemistry (UK). Lanthanides and Actinides are not included. Periodic Table – melting point: The height represents melting point. Most elements in Period 7 have unknown values and are shown without height. Trends: Melting point generally decreases down a group. Melting point generally increases across a period. Data source: The Royal Society of Chemistry (UK). Lanthanides and Actinides are not included. Periodic Table – year of discovery: The height represents the year of discovery. Elements known since antiquity are shown with a height of zero. For clarity, all other years are shown relative to the year 1200. Scale: 1 mm = 100 years
- Nutzungsrechte
-
Vervielfältigung und Verbreitung erlaubt. Namensnennung erforderlich. Weitergabe unter gleichen Bedingungen.CC BY-SA
- Herkunftsnachweis
- "periodic table trends (zip-Datei)" von , lizenziert unter CC BY-SA 3.0
- Original-URL
- https://tactiles.eu/3d-model/periodic-table-trends/
Sarah Hayman
| Lernressource | Entdeckendes Lernen, Daten |
| Lizenz | CC BY-SA 3.0 |
| Beruf |
|
| Sprache | Englisch |
Medium melden
verknüpfte Materialien
ähnliche Materialien


Als Anwendung installieren
Installieren Sie HubbS als App für ein besseres Nutzungserlebnis. Mehr erfahren.
Abbrechen